By the Numbers: What does it take to win the Pac-12?
By Shravan Janakiraman
In nine years of Pac-12 football, USC has won just one conference title and played in just two championship games. Heading into the tenth season of the Pac-12, we take a look at where the Trojans have ranked against the Pac-12 champion in a number of statistical categories from year to year and a few trends that have emerged.
Recapping the Pac-12 champions
2011 - Oregon
2012 - Stanford
2013 - Stanford
2014 - Oregon
2015 - Stanford
2016 - Washington
2017 - USC
2018 - Washington
2019 - Oregon
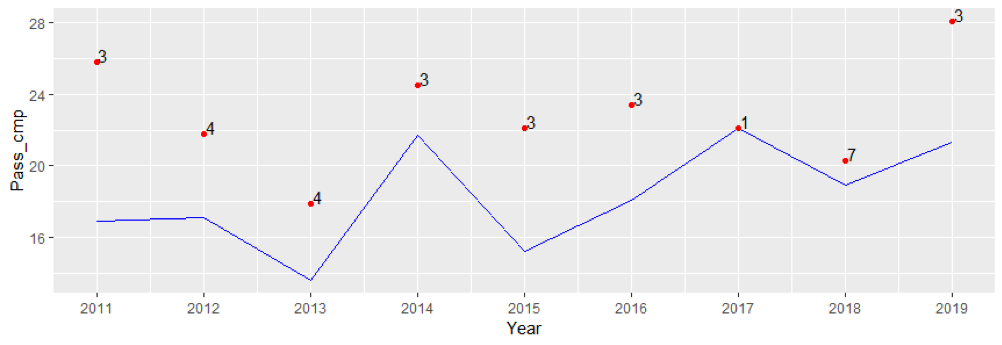
Explaining the charts
Blue line = Pac-12 Champion
Red dot = USC (number indicates where the Trojans finished in the Pac-12 standings)
Offensive Stats
Passing
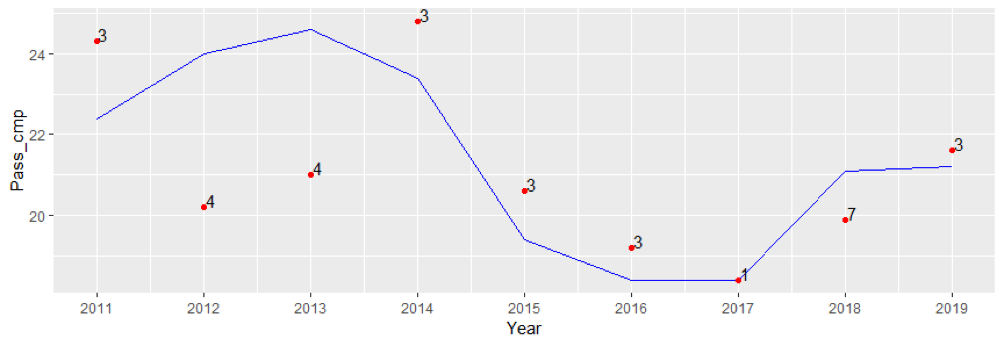
Completions per game
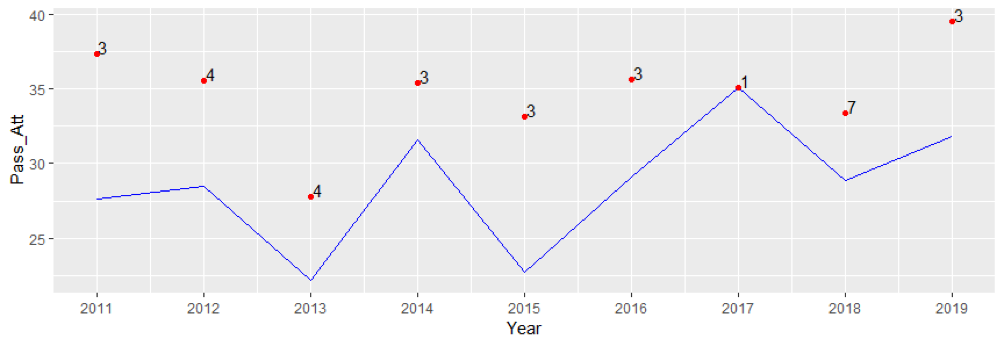
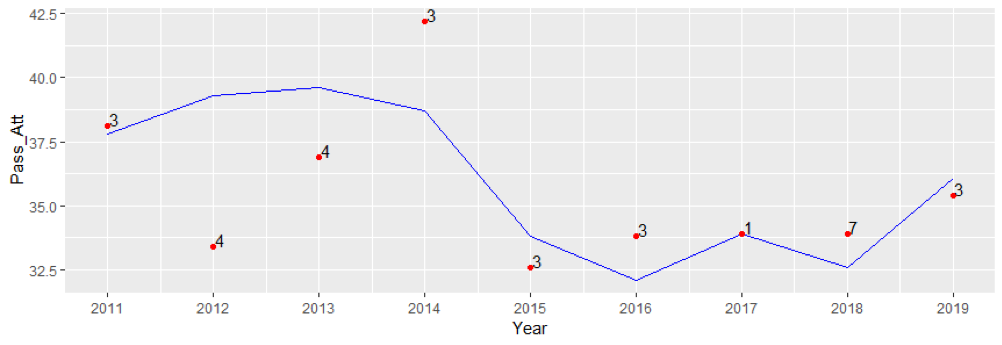
Passing attempts per game
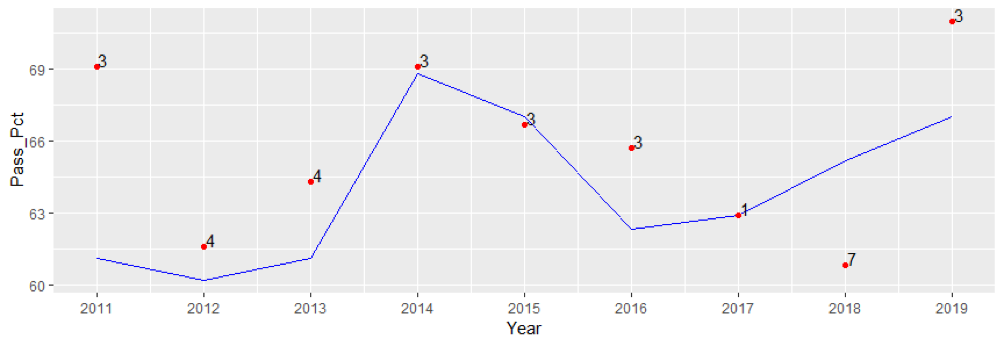
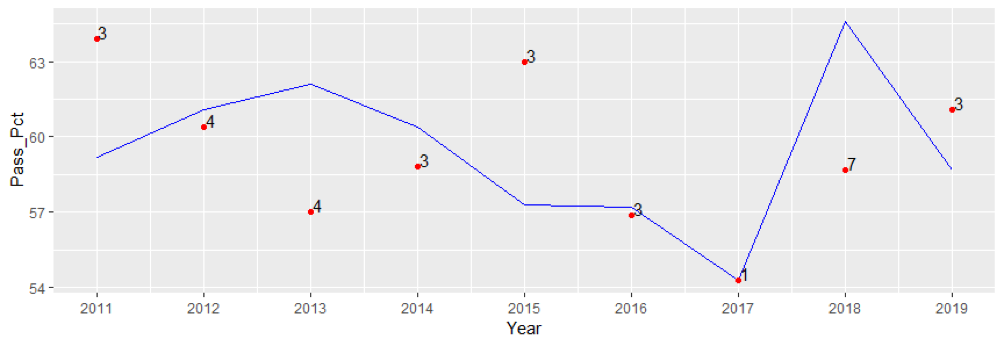
Pass completion percentage
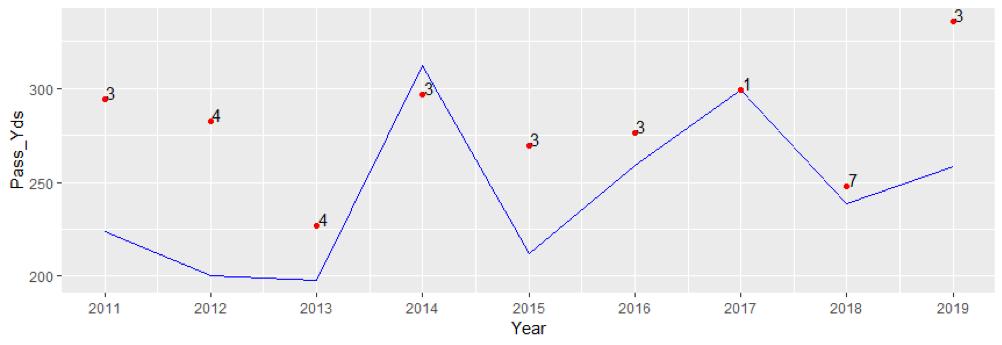
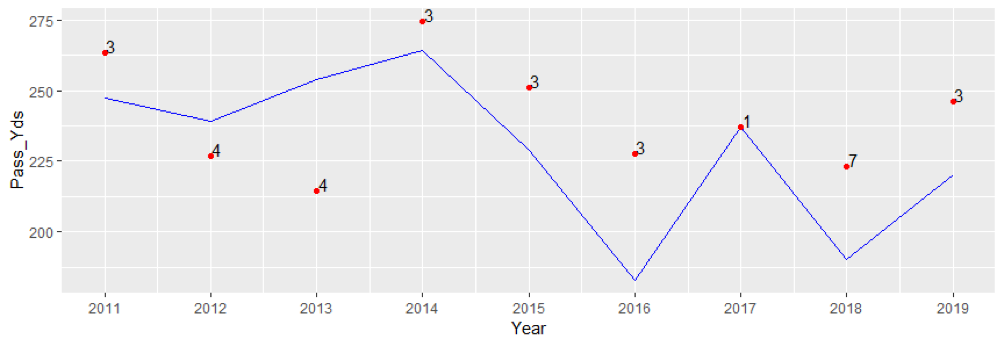
Passing yards per game
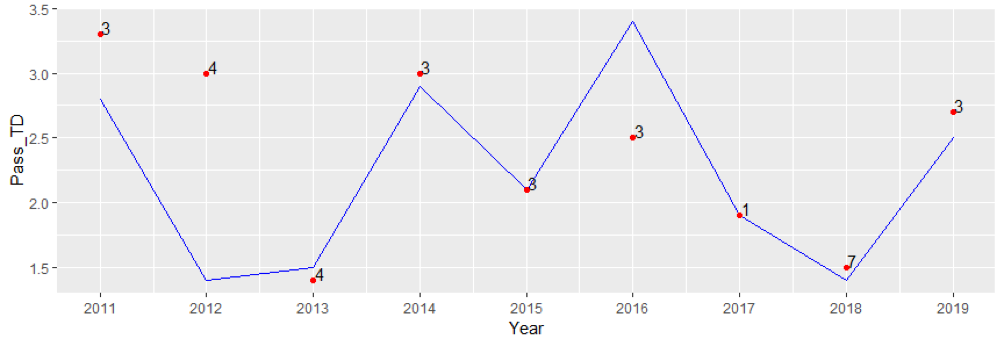
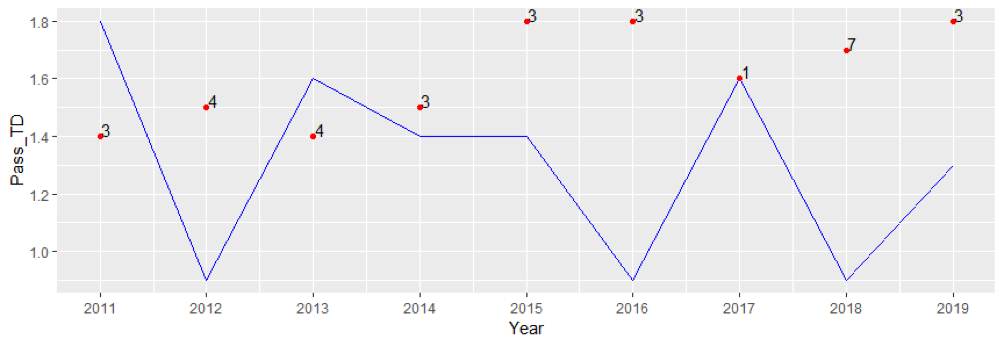
Passing touchdowns per game
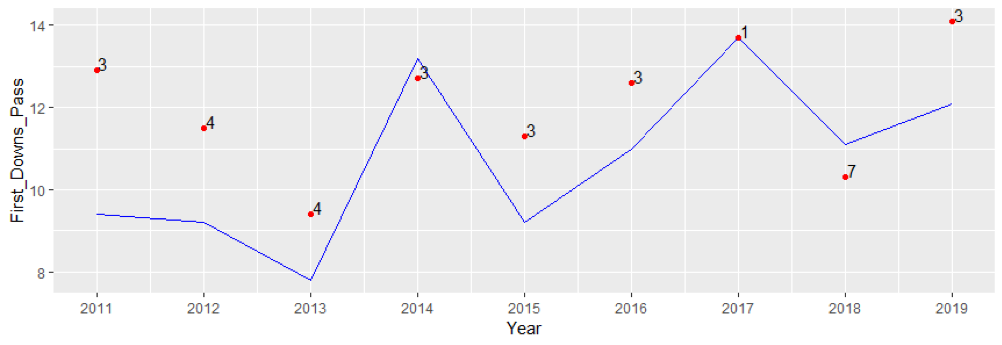
First downs passing per game
Passing Stats Summary:
1. In the Pac-12 era, USC has attempted, completed, and thrown for more yards (except for 2014) than the eventual PAC 12 champion. USC is likely to lead the PAC 12 or end up close to the top spot in passing stats in the 2020 season, given Graham Harrell’s proclivity for throwing the football and Mike Leach exiting the division. However, based on the above data, leading the pass stats does not mean much in terms of winning the division.
2. Outside of USC in 2017 (35.1 pass attempts per game), no Pac-12 champion has attempted more passes than Oregon in 2014 (31.6) and 2019 (31.8). Oregon was quarterbacked by eventual first rounders Marcus Mariota and Justin Herbert in 2014 and 2019, respectively.
In Graham Harrell’s first year, USC attempted 39.5 passes per game. If this style of offense were to continue, USC will have to break the mold with a talented sophomore QB to win the Pac-12. Sam Darnold, Juju Smith-Schuster and others did it in 2017. Can Kedon Slovis, Tyler Vaughns, Amon-Ra St. Brown and an inexperienced offensive line with reduced practice time, do the same in 2020?
Rushing
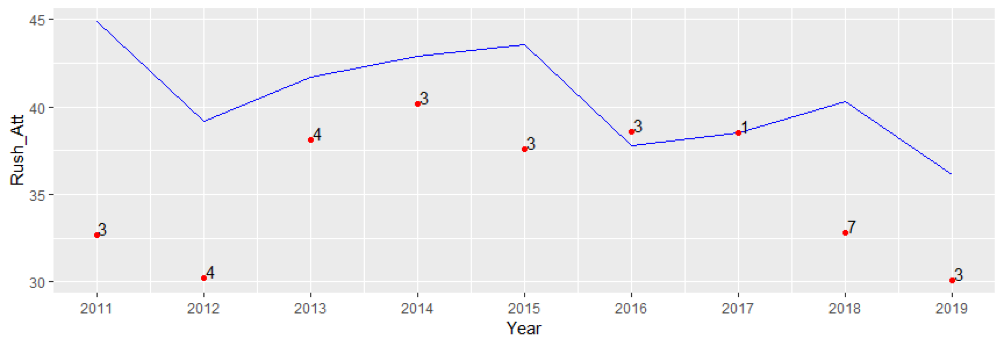
Rush attempts per game
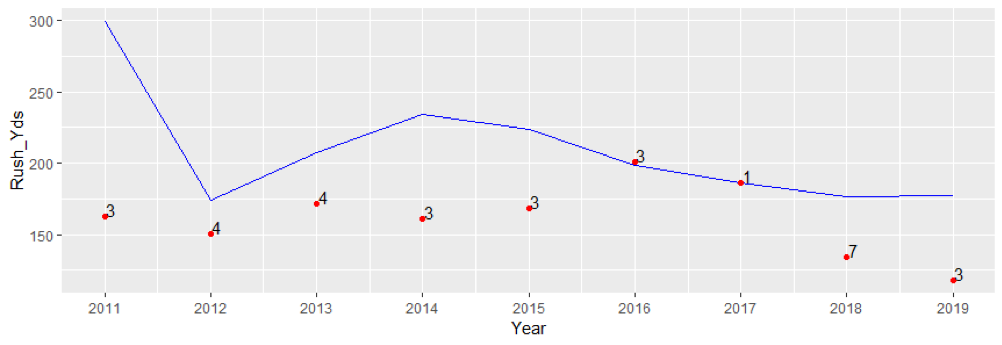
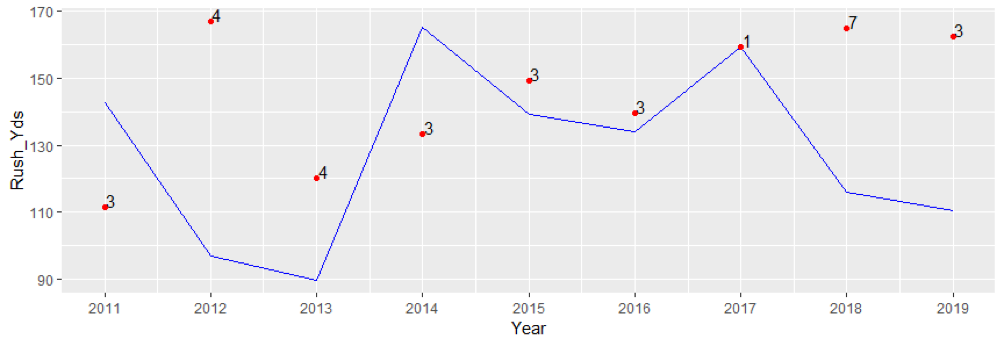
Rushing yards per game
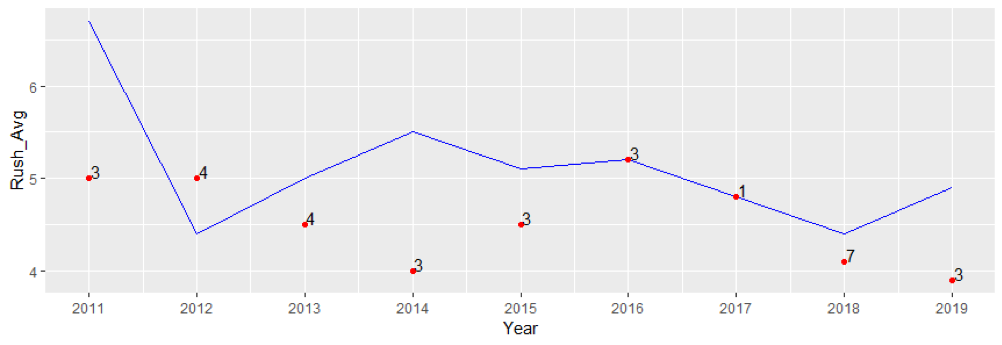
Average yards per rushing attempt
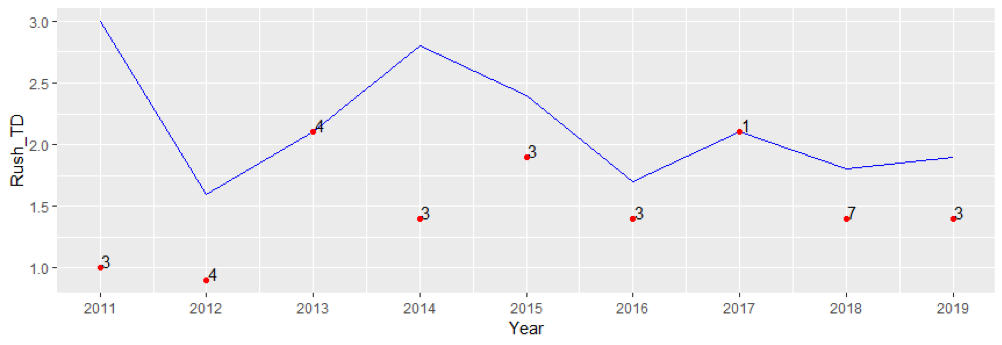
Rushing touchdowns per game
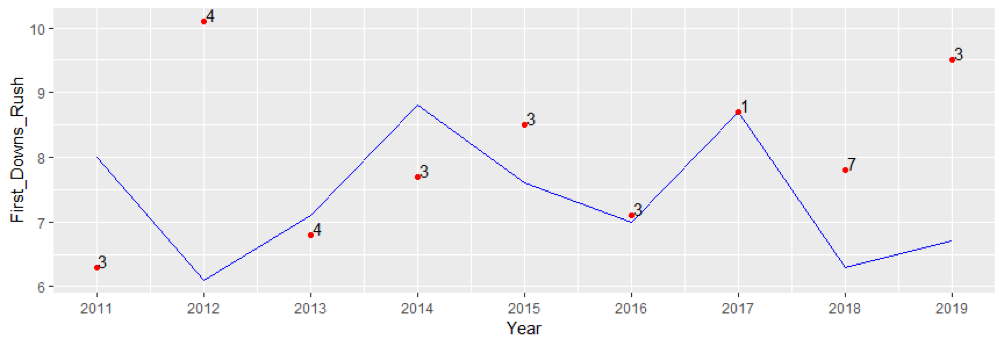
First downs rushing per game
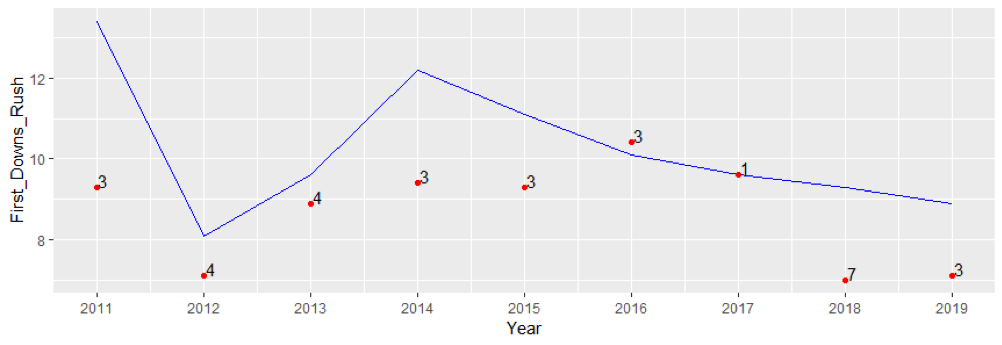
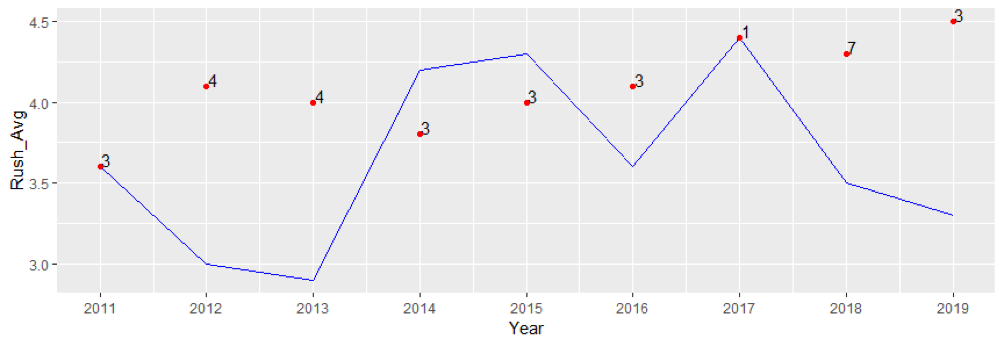
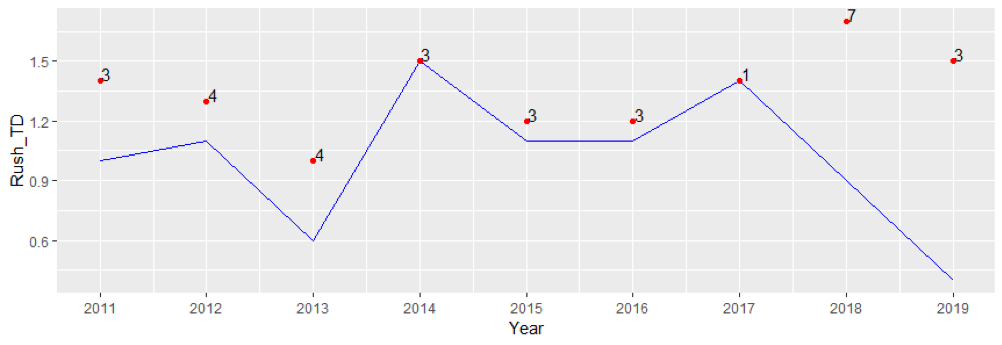
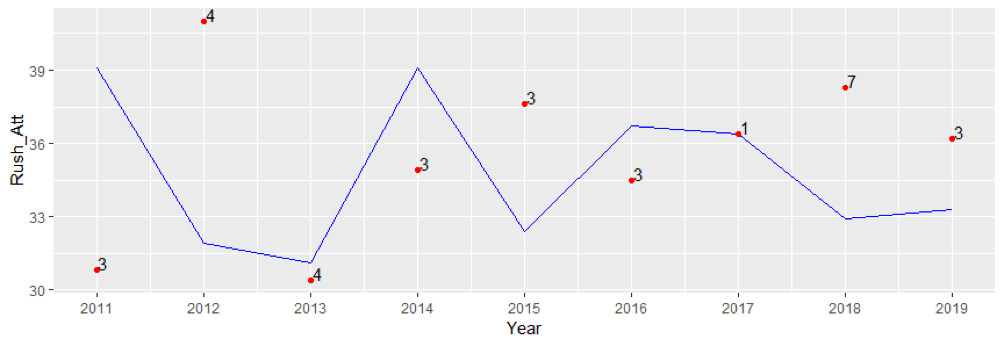
Rush Stats Summary:
1. The eventual Pac-12 champion has attempted and rushed for more yards than USC each year except for 2016. In 2016, Tailback U, behind a potent Sam Darnold, Justin Davis and Ronald Jones offense rushed for more yards than the eventual Pac-12 champion, Washington, who they also beat for a signature win at Husky Stadium.
2. USC had its two best rushing seasons in 2016 (201 ypg) and 2017 (186.2 ypg), which coincided with their most successful years in the Pac-12.
3. No Pac-12 champion has ever rushed for less than 4.4 yds per attempt. In 2019, Graham Harrell’s first season at USC, USC rushed for 3.9 yards per attempt.
4. The fewest rushing yards per game to win a Pac-12 championship was 174.3 in 2012 (Stanford). USC rushed for just 118.2 yards per game in 2019.
5. In 2019, USC gained twice as many first downs passing the ball compared to rushing (14.1 vs 7.1). No previous Pac-12 champion has ever had a higher ratio than 1.42 (USC, 2017). Oregon, in 2019, had a ratio of 1.39.
Defensive Stats
Passing defense
Passing yards allowed per game
Passing touchdowns allowed per game
Completions allowed per game
Passing attempts per game
Completion percentage allowed
Pass Defense Summary:
1. The USC defense has allowed more passing yards than the eventual non-USC Pac-12 champion in six of eight seasons.
2. The USC defense has allowed more passing touchdowns than the eventual non-USC Pac-12 champion in six of eight seasons.
3. Interestingly, in 2012, at the height of the famed Monte Kiffin bend-but-don’t-break scheme, USC allowed fewer passing yards than the eventual champion Stanford. They did however break to give up more passing touchdowns than Stanford. The opposition also ran for 167.0 yards per game, the most USC has allowed in the Pac-12 era.
Rushing defense
Rushing yards allowed per game
Rushing yards allowed per attempt
Rushing touchdowns allowed per game
Rushing attempts allowed per game
Rush Defense Summary:
1. USC has allowed fewer rushing yards per game than the eventual Pac-12 champion only twice in the Pac-12’s nine-year history
2. USC has never allowed fewer rushing touchdowns than the eventual Pac-12 champion.
3. USC’s offensive and defensive rushing stats show that it has not consistently won the physical battle in the trenches compared to the Pac-12 champion. The last three seasons have produced three of the four worst seasons in Pac-12 play in terms of rushing yards allowed per game for the Trojans.
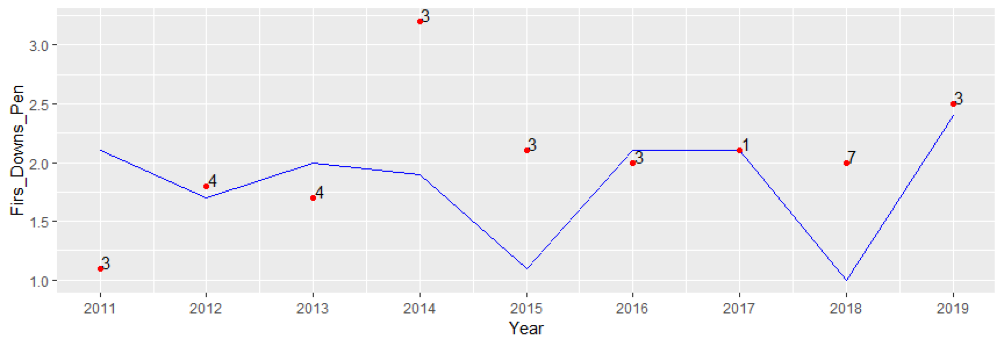
Penalties
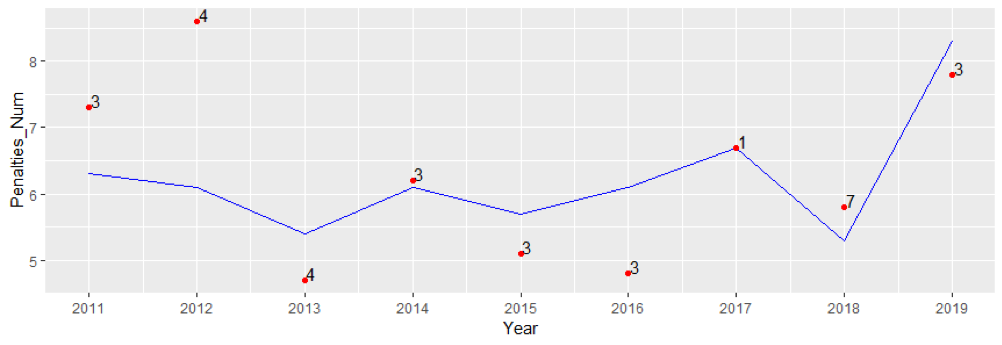
Offensive penalties per game
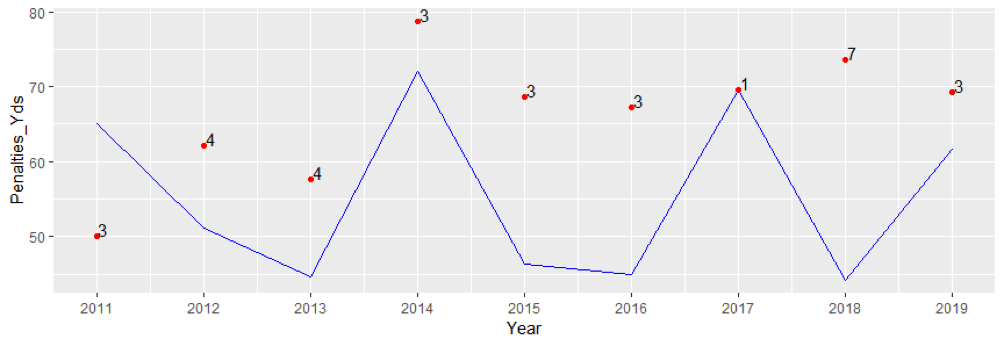
Offensive penalty yards per game
Defensive penalties per game
Defensive penalty yards per game
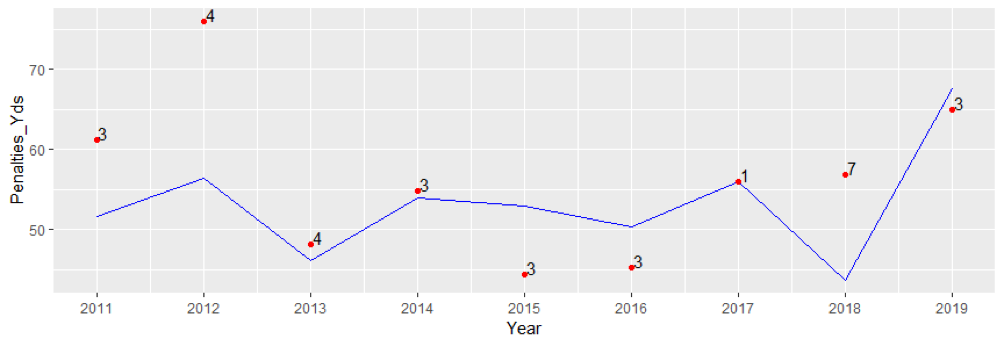
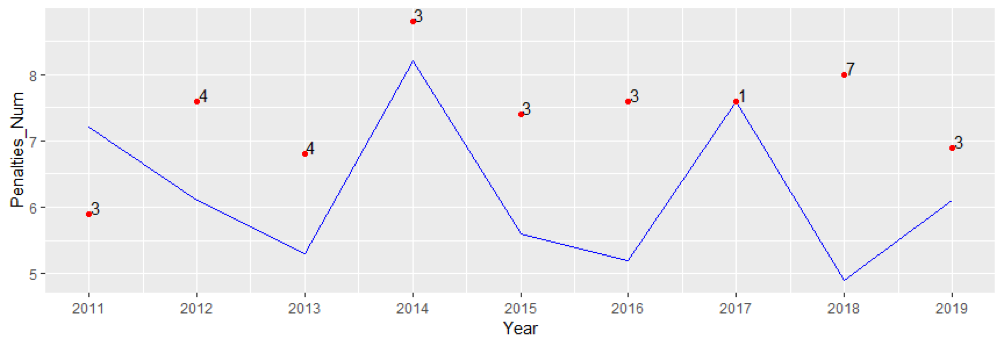
Penalties Summary:
1. Except for the 2011 season, USC has had more offensive penalties and offensive penalty yards per game than the eventual Pac-12 champion.
2. On the defensive side, USC performs marginally better. They had fewer defensive penalty yards than the eventual champion in 2015, 2016 and 2019.
3. USC improved moderately in terms of offensive penalties from 2018 to 2019, but there was a noticeable uptick on the defensive side. Penalties will again be a likely talking point for Helton during the 2020 season.
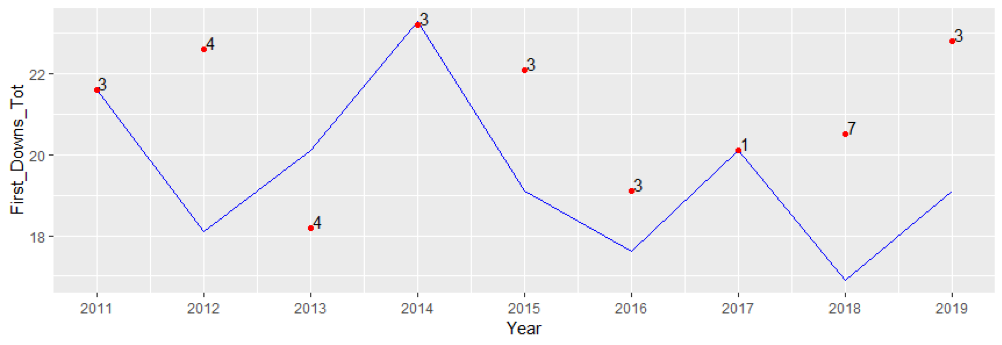
Miscellaneous Offense
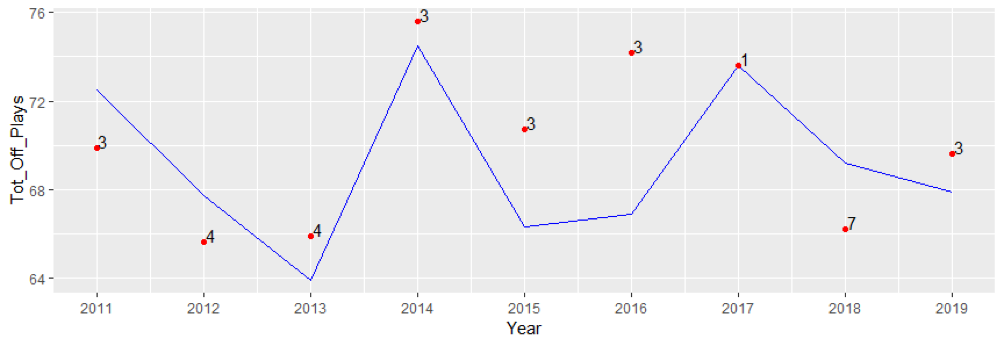
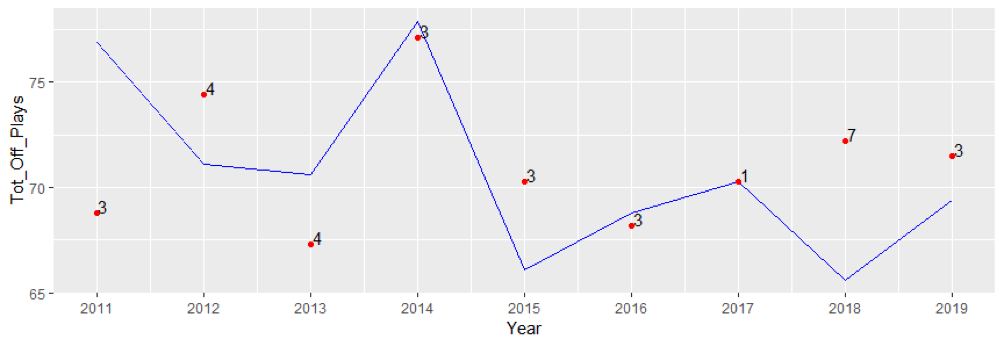
Total offensive plays per game
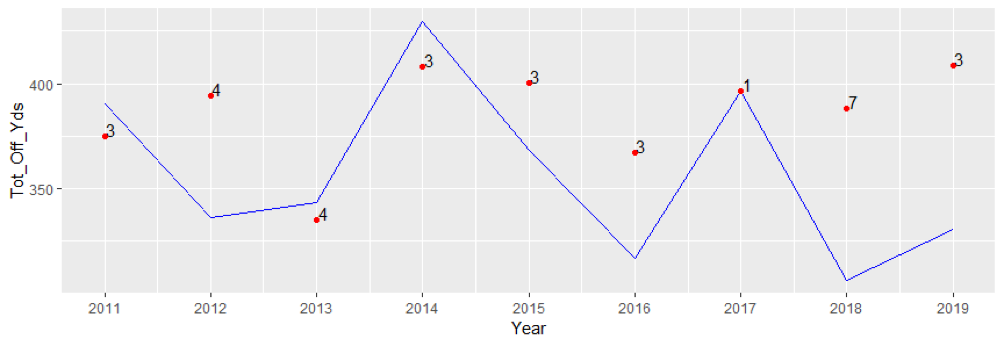
Total offensive yards per game
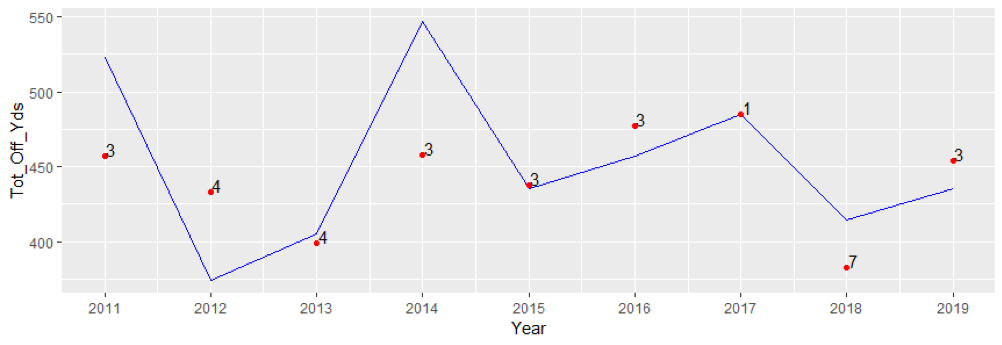
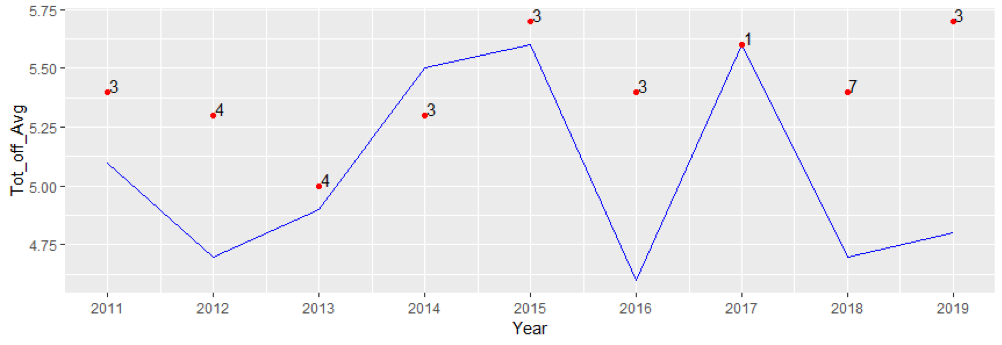
Offensive yards per play
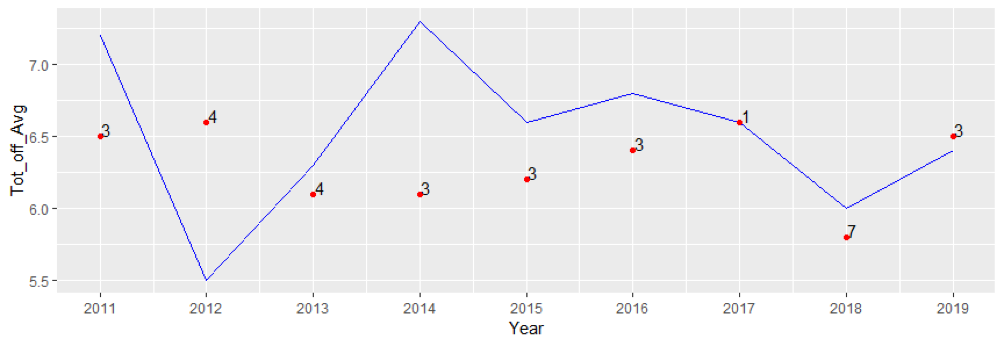
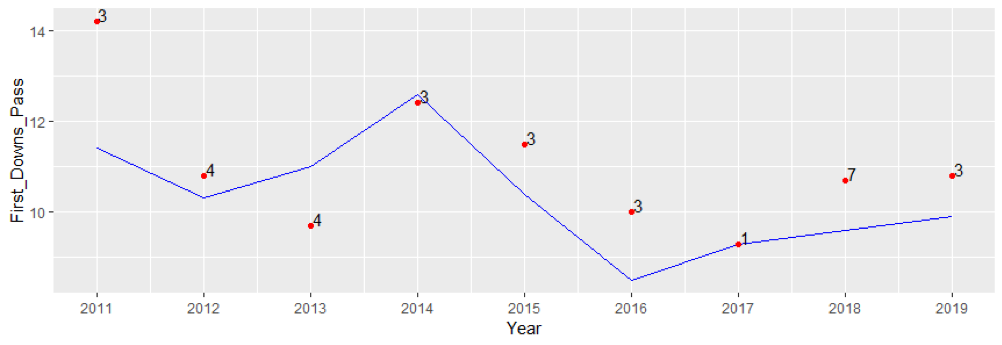
First downs gained per game

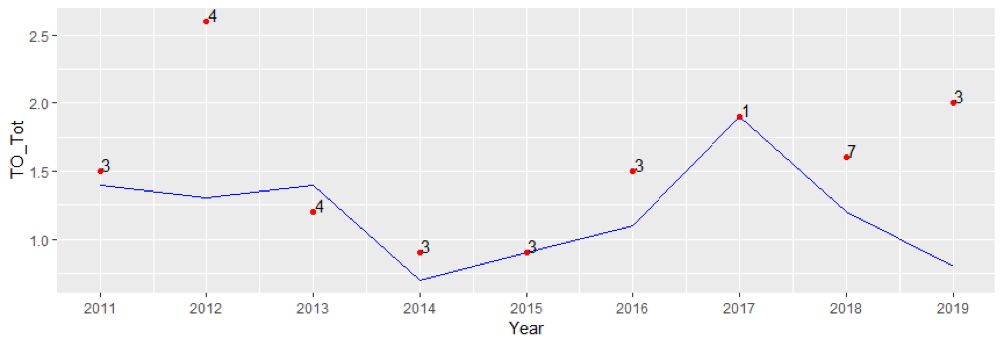
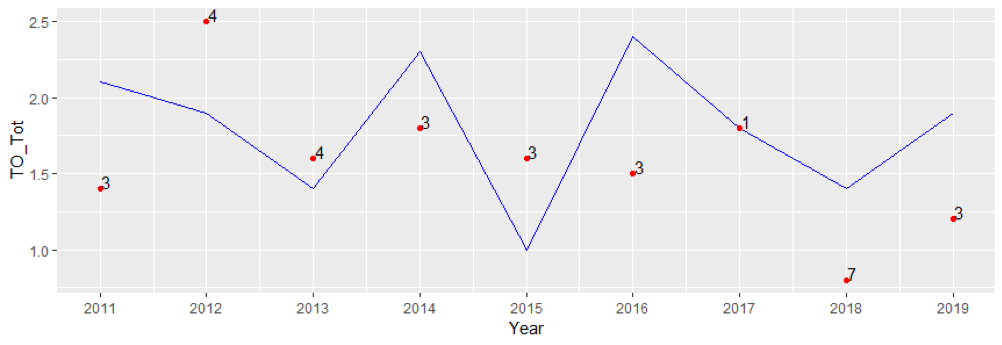
Offensive turnovers per game
Sacks allowed per game
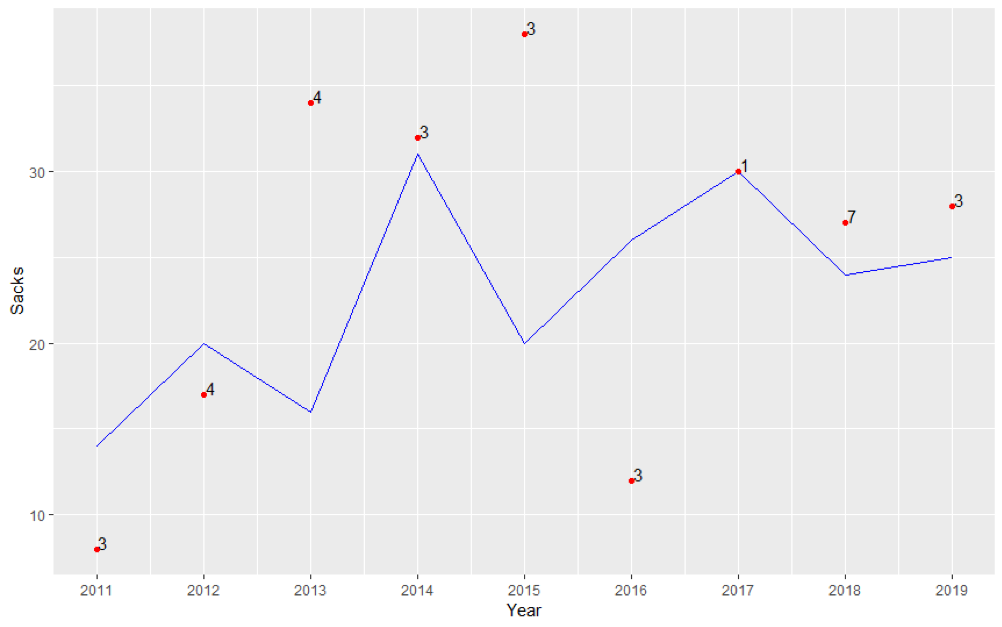
Miscellaneous Offense Summary:
1. USC ran more offensive plays per game in 2019 than 2018, but it wasn't the huge uptick that was expected in the first year of Harrell's offense. The Trojans ran more plays per game in 2011, 2014, 2015, 2016 and 2017.
2. Turnovers continue to be a major problem for the USC offense. USC's mark in each of the past four years is more than any non-USC Pac-12 champion.
Miscellaneous Defense
Total offensive plays allowed per game
Total offensive yards allowed per game
Offensive yards allowed per play
Passing first downs allowed per game
Rushing first downs allowed per game
First downs via penalty allowed per game
Total first downs allowed per game
Turnovers created per game
Miscellaneous Defense Summary:
1. USC's defense must create more turnovers. Not only are the marks in the last two years's well below the Pac-12 champions, they are also the two lowest marks of the past nine years for the Trojans.
2. The new defensive coaches will have a few trends to stop, as USC's numbers declined from 2018 to 2019 in total yards, yards per play and first downs allowed in every way.