By the numbers: USC's 2019 Rushing Stats
By Shravan Janakiraman
USC’s 2019 rushing stats are compared to two successful teams – LSU 2019 and USC 2017, to determine the gap between rushing performances of recently successful CFB teams.
LSU in 2019 threw the ball 52.5% of the time compared to USC’s 56.7% in 2019. USC’s 2019 rushing stats are compared to LSU’s 2019 National Championship winning rushing stats because these offenses primarily focused on throwing the ball.
USC in 2017 threw the ball on only 47.4% of its offensive plays. However, USC’s 2019 rushing stats are compared to USC’s Pac-12 winning 2017 rushing stats, because they are both examples of Clay Helton coached teams against Pac-12 defenses.
USC ’17 and LSU ’19 are also examples of winning teams, a destination USC's 2020 team (if the season happens) would like to reach. So, this is a study in what it would take, rushing-wise, for USC 2020 to reach that destination.
It must be kept in mind that the rushing stats only present half the story. A poor rushing attack can in theory be overcome by a truly great passing attack. However, a good, efficient rushing attack in a pass-dominant offense can complement the passing game, keep and defense honest and most importantly stop the opposing defense from keying in on Kedon Slovis, an imperative, given USC’s inability to keep its starting quarterbacks from getting injured in games last year.
There should be no reason why a pass-dominant offense can't have an efficient rushing attack when it chooses to run.
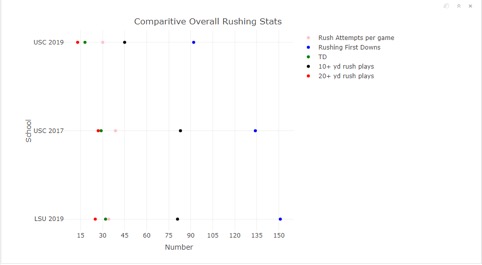
Overall Rushing Stats
a) USC averaged fewer rush attempts per game compared to LSU ’19 and USC ’17.
b) USC had 38% fewer rushing first downs compared to LSU ’19 (92 vs 151).
c) USC had 43% fewer rushing touchdowns compared to LSU ’19 (18 vs 31).
d) In terms of explosive runs, USC had almost 50% fewer 20+ yd runs and 40% fewer 10+ yd runs compared to LSU’ 19 and USC’ 17.
e) Overall, USC’s 2017 rushing numbers compare favorably to LSU 2019.
f) These stats show that, while it is possible to win championships with a pass heavy attack, like USC will likely employ in 2020, a repeat of USC’s 2019 rushing performance in 2020 will not be efficient or explosive enough to complement the passing game.
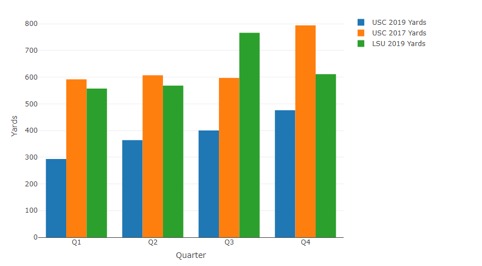
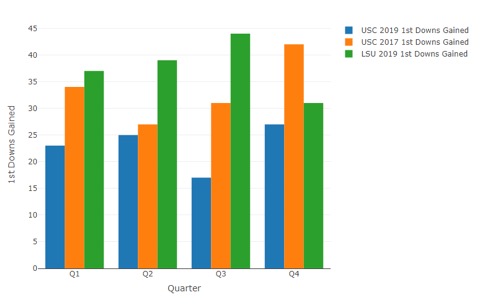
Rushing Stats by Quarter
a) USC’s 2019 rushing yards steadily increased as the game wore on (Fig. 2)
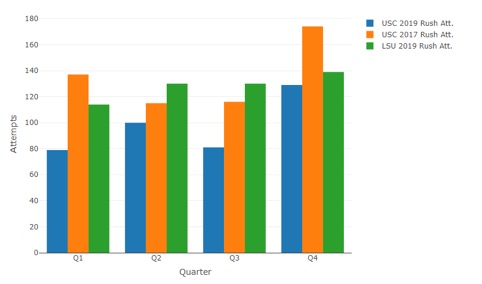
b) USC’s 2019 rush attempts increased in the latter quarter of each half (+25% Q2 vs Q1 and (+33% Q4 vs Q3) (Fig. 3)
c) USC 2019 rushed for significantly fewer yards per quarter compared to USC 2017 and LSU 2019. The smallest gap was 28% between USC ’19 and LSU ’19 in Q4.
d) Although the rush attempts in Q2 and Q3 for LSU ’19 were almost the same, LSU rushed for 35% more yards in Q3 compared to Q2. This could be a possible indication of half-time changes by the coaching staff.
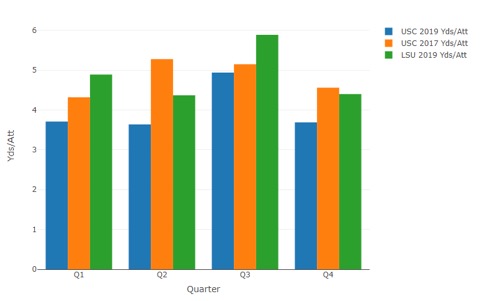
e) USC in 2019 increased its ypa by 35% in Q3 compared to Q2 (Fig. 4), a similar number to LSU in 2019. However, this number is inflated by the fact that the baseline rushing yards for USC ’19 in Q2 is 56% lesser than LSU ’19 Q2.
f) USC ’19 compares quite poorly to USC’ 17 and LSU ’19 in terms of rushing first downs gained (Fig. 5). Nowhere is the difference starker than in Q3, where USC ’19 has 45% fewer rushing first downs than USC ’17 and 61% fewer first downs than LSU ’19. Increasing rushing first downs in 2020 will allow the USC offense to keep more drives alive and simultaneously keep Todd Orlando’s first-year USC defense off the field.
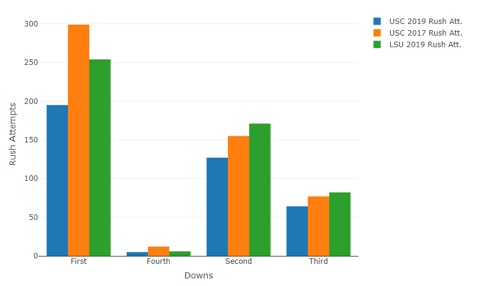
Rushing Stats by Downs
a) USC ’19 attempted 35% fewer rushes on first down compared to USC ’17, a clear demonstration of a change in offensive philosophy (Fig. 6). The difference, however, is less profound on second and third downs.
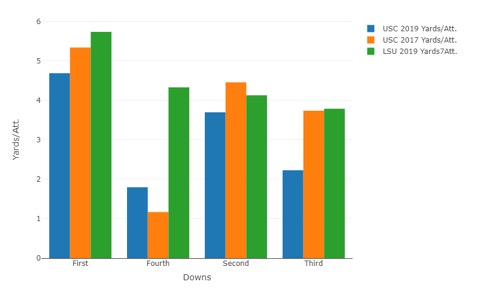
b) When USC ’19 chose to run the ball on first downs, its yards per attempts was 4.67 (Fig. 7), behind USC ’17 (5.34) and LSU ’19 (5.74). Maybe smarter, more knowledgeable minds can detail scheme changes, if any, that led to this reduction in rushing efficiency?
c) On third downs, USC’s ’19 ypa was 2.2 compared to 3.7 for both USC ’17 and LSU ’19. When USC ’19 really wanted to run the ball, it wasn’t able to do so with great success.
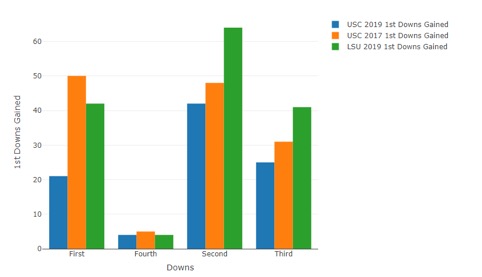
d) USC ’19 gained first downs only 11% of the time it rushed on first down (Fig. 8). By contrast USC ’17 and LSU ’19 gained first downs on 17% of their first down rushes.
e) USC ’19 gained first downs on 39% of its third down rushes compared to 50% for LSU ’19. USC ’17, also, only gained first downs on 40% of its third down rushes, a number like USC ’19.
f) On a positive note, USC ’19 converted 4 of 5 fourth down attempts, a better conversion rate than LSU ’19, which was 4 of 6. USC ’17 was a paltry 5 of 12.
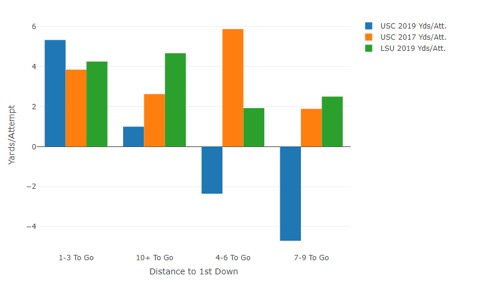
Rushing Stats by Third Down Distance to First Down:
a) On third down, when 1-3 yards are required for a first down, USC ’19 fares better than USC ’17 and LSU ’19 by rushing for 5.3 ypa compared to 3.8 for USC ’17 and 4.2 for LSU ’19 (Fig. 9). A rare statistic where USC ’19 comes out on top.
b) However, on third down, with 4-6 yards to go, USC averages -2.3 ypa (yes, a negative number). Given the talent disparity between USC and most of the Pac-12, USC fans will find this number hard to accept. USC ’17 averaged a fantastic 5.8 ypa while LSU ’19 was poor by its standards with 1.9 ypa. This means that on average, USC ’17 ran the ball for 8 yards more per attempt than USC ’19, with 4-6 yds to go for a first down.
c) On third down, with 7-9 yards to go, USC’ 19 performs even worse by rushing for a -4.71 ypa. The winner in this category is LSU ’19 with 2.5 ypa.
d) USC ’19 rushing converted third downs on 24 of 36 attempts when the distance to go was between 1-3 yards, a conversion percentage of 66%. Coincidentally, USC ’17 and LSU ’19 converted on third downs with the same efficiency.
e) On third downs, when the distance to convert was greater than 4 yards, USC ’19 had 28 rush attempts. USC ’19 converted 1 of those attempts. Let that sink in. In other words, over the course of the whole season, USC ’19 converted only 1 rushing third down where it needed at least 4 yards to convert. USC ’17 converted 9 of 44 and LSU ’19 8 of 32 attempts.
f) The above two stats point to, if the odds on third down rushing conversion are high, USC ’19 performed as well as USC’ 17 and LSU ’19. When the odds of conversion were low, USC ’19 had a success rate of 3.5% compared to 20% and 25% for USC ’17 and LSU ’19 respectively.
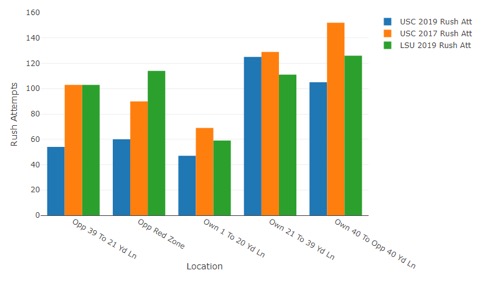
Rushing Stats by Location:
a) USC ran the ball fewer times than USC ’17 and LSU ’19 in all parts of the field (Fig. 10).
b) In the opponent’s half, between the 39-yard line and the end zone, USC ’19 had approximately half the rush attempts as LSU ’19 – 114 vs 217.
c) If one were to compare the two Clay Helton teams, USC ’19 had a similar number of rush attempts compared to USC ’17 only between its own 21-39 yard line. Everywhere else on the field, there was a significant difference in the number of rush attempts.
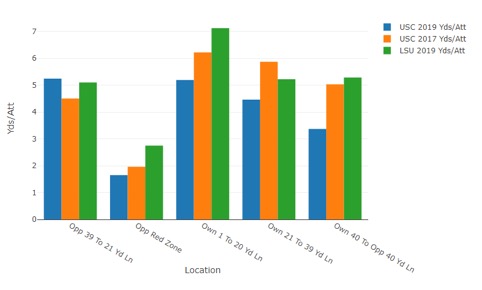
d) USC’s yards per attempt compares favorably to the other two teams only between the opponent 39-21 yard line, where USC ’19 averages 5.2 ypa (Fig. 11).
e) USC also averages 5.2 ypa between its own 1-20 yard line. These are the two regions on the field where USC ’19 rushing attack performs the best.
f) In the red zone, where the field is constricted, USC ’19 averages 1.65 ypa compared to 1.96 for USC ’17. LSU ’19 averages a whole yard more per rush attempts compared to USC ’19 with 2.75 ypa.
g) In the red zone, USC ’19 converted to first down on 12 of 60 attempts despite a ypa of 1.65 in this part of the field (Fig. 12). LSU ’19 had a similar conversion percentage of 20.1%. USC ’17 lagged behind with 12% conversion rate.
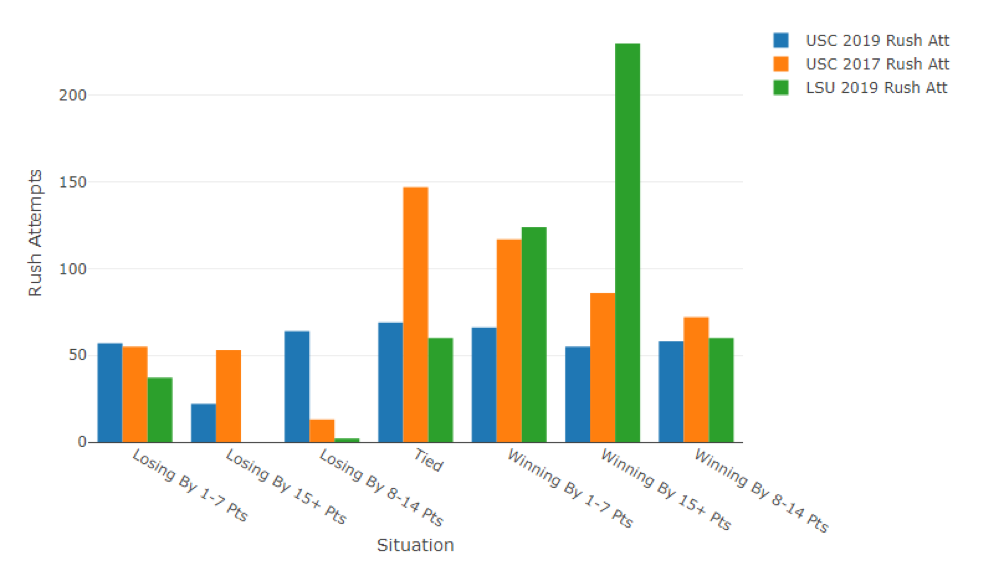
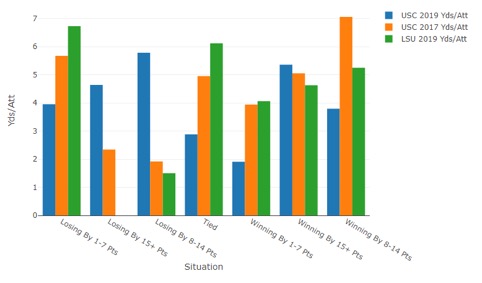
Rushing Stats by Game Situation:
a) The first statistic that stands out in Fig. 12 is the dominant season LSU ’19 had. LSU ’19 attempted more than 4 times as many rushes as USC ’19 and more than 2.5 times as many rushes as USC ’17 when leading by 15+ points, a sign of how often they were ahead by 15+ points.
b) Over the course of the complete season LSU ’19 only had 2 rushes when they were down by 8+ points, a sign of how rarely they were down by 8+ points. By contrast USC ’19 had 86 rush attempts when down by 8+ points.
c) USC ’19 rush attempts did not vary significantly based on the game situation, except when they were losing by 15+ points, where they had the fewest number of rush attempts with 22.
d) USC ’19s three best ypa numbers were when they were winning by 15+ points - a sign they were the dominant team, and losing by 8-14 points and 15+ points – a likely sign the opposition were more concerned about stopping the big pass play than the rush game (Fig. 13).
e) USC ‘19s two worst ypa numbers were seen when the game was tied (2.8 ypa) or when USC was leading by 1-7 points (1.9 ypa).
* All stats taken from cfbstats.com